
Hypertension is known as the “silent killer.” Patients often don’t have symptoms, so they don’t feel the urgency to visit their doctor. Even patients who know they have high blood pressure and are enrolled in a hypertension control program often lapse in care. In Bangladesh, for instance, almost ⅓ of patients enrolled in the otherwise excellent National Heart Foundation of Bangladesh hypertension control program don’t come back to care regularly.
“Almost ⅓ of patients enrolled in the otherwise excellent National Heart Foundation of Bangladesh hypertension control program don’t come back to care regularly”
What can be done?
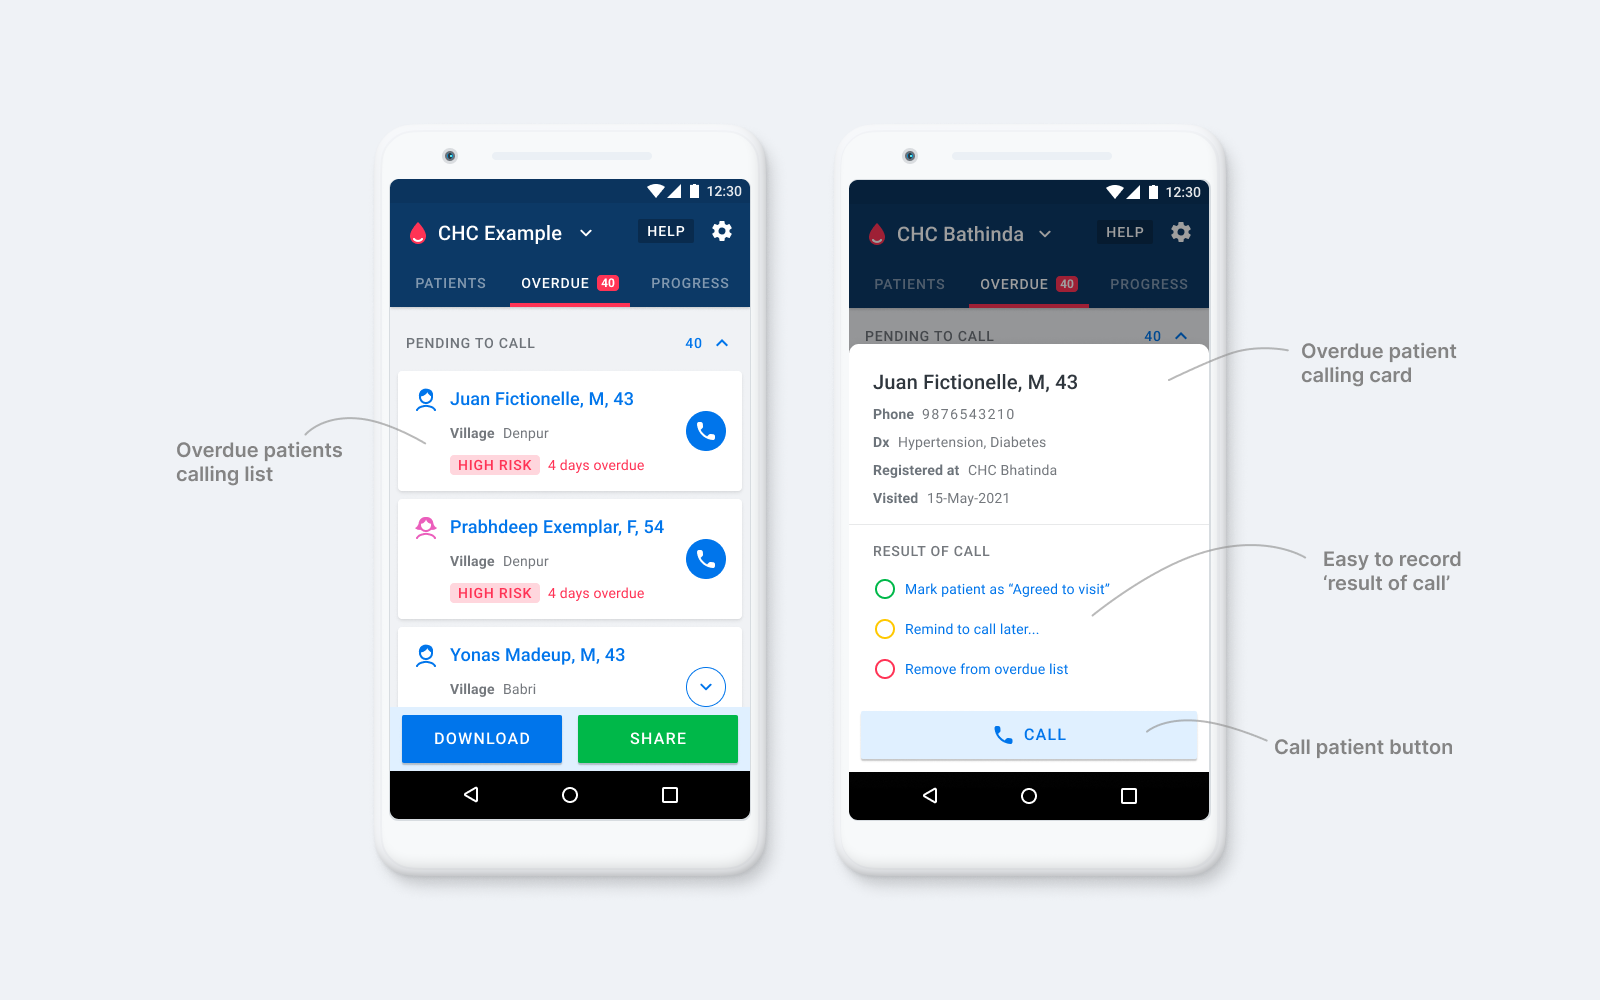
A healthcare worker calling patients to urge them to return to care is one of the most effective ways to encourage patients to return to care for medication refills and an up-to-date BP reading. The Simple app creates easy-to-use call lists but how can program managers encourage busy healthcare workers to call patients? Data can help.
By revealing key data, Simple empowers program managers to know:
- 1. How many patients need to be called?
- 2. Were those patients called?
- 3. Were the calls successful in returning patients to care?
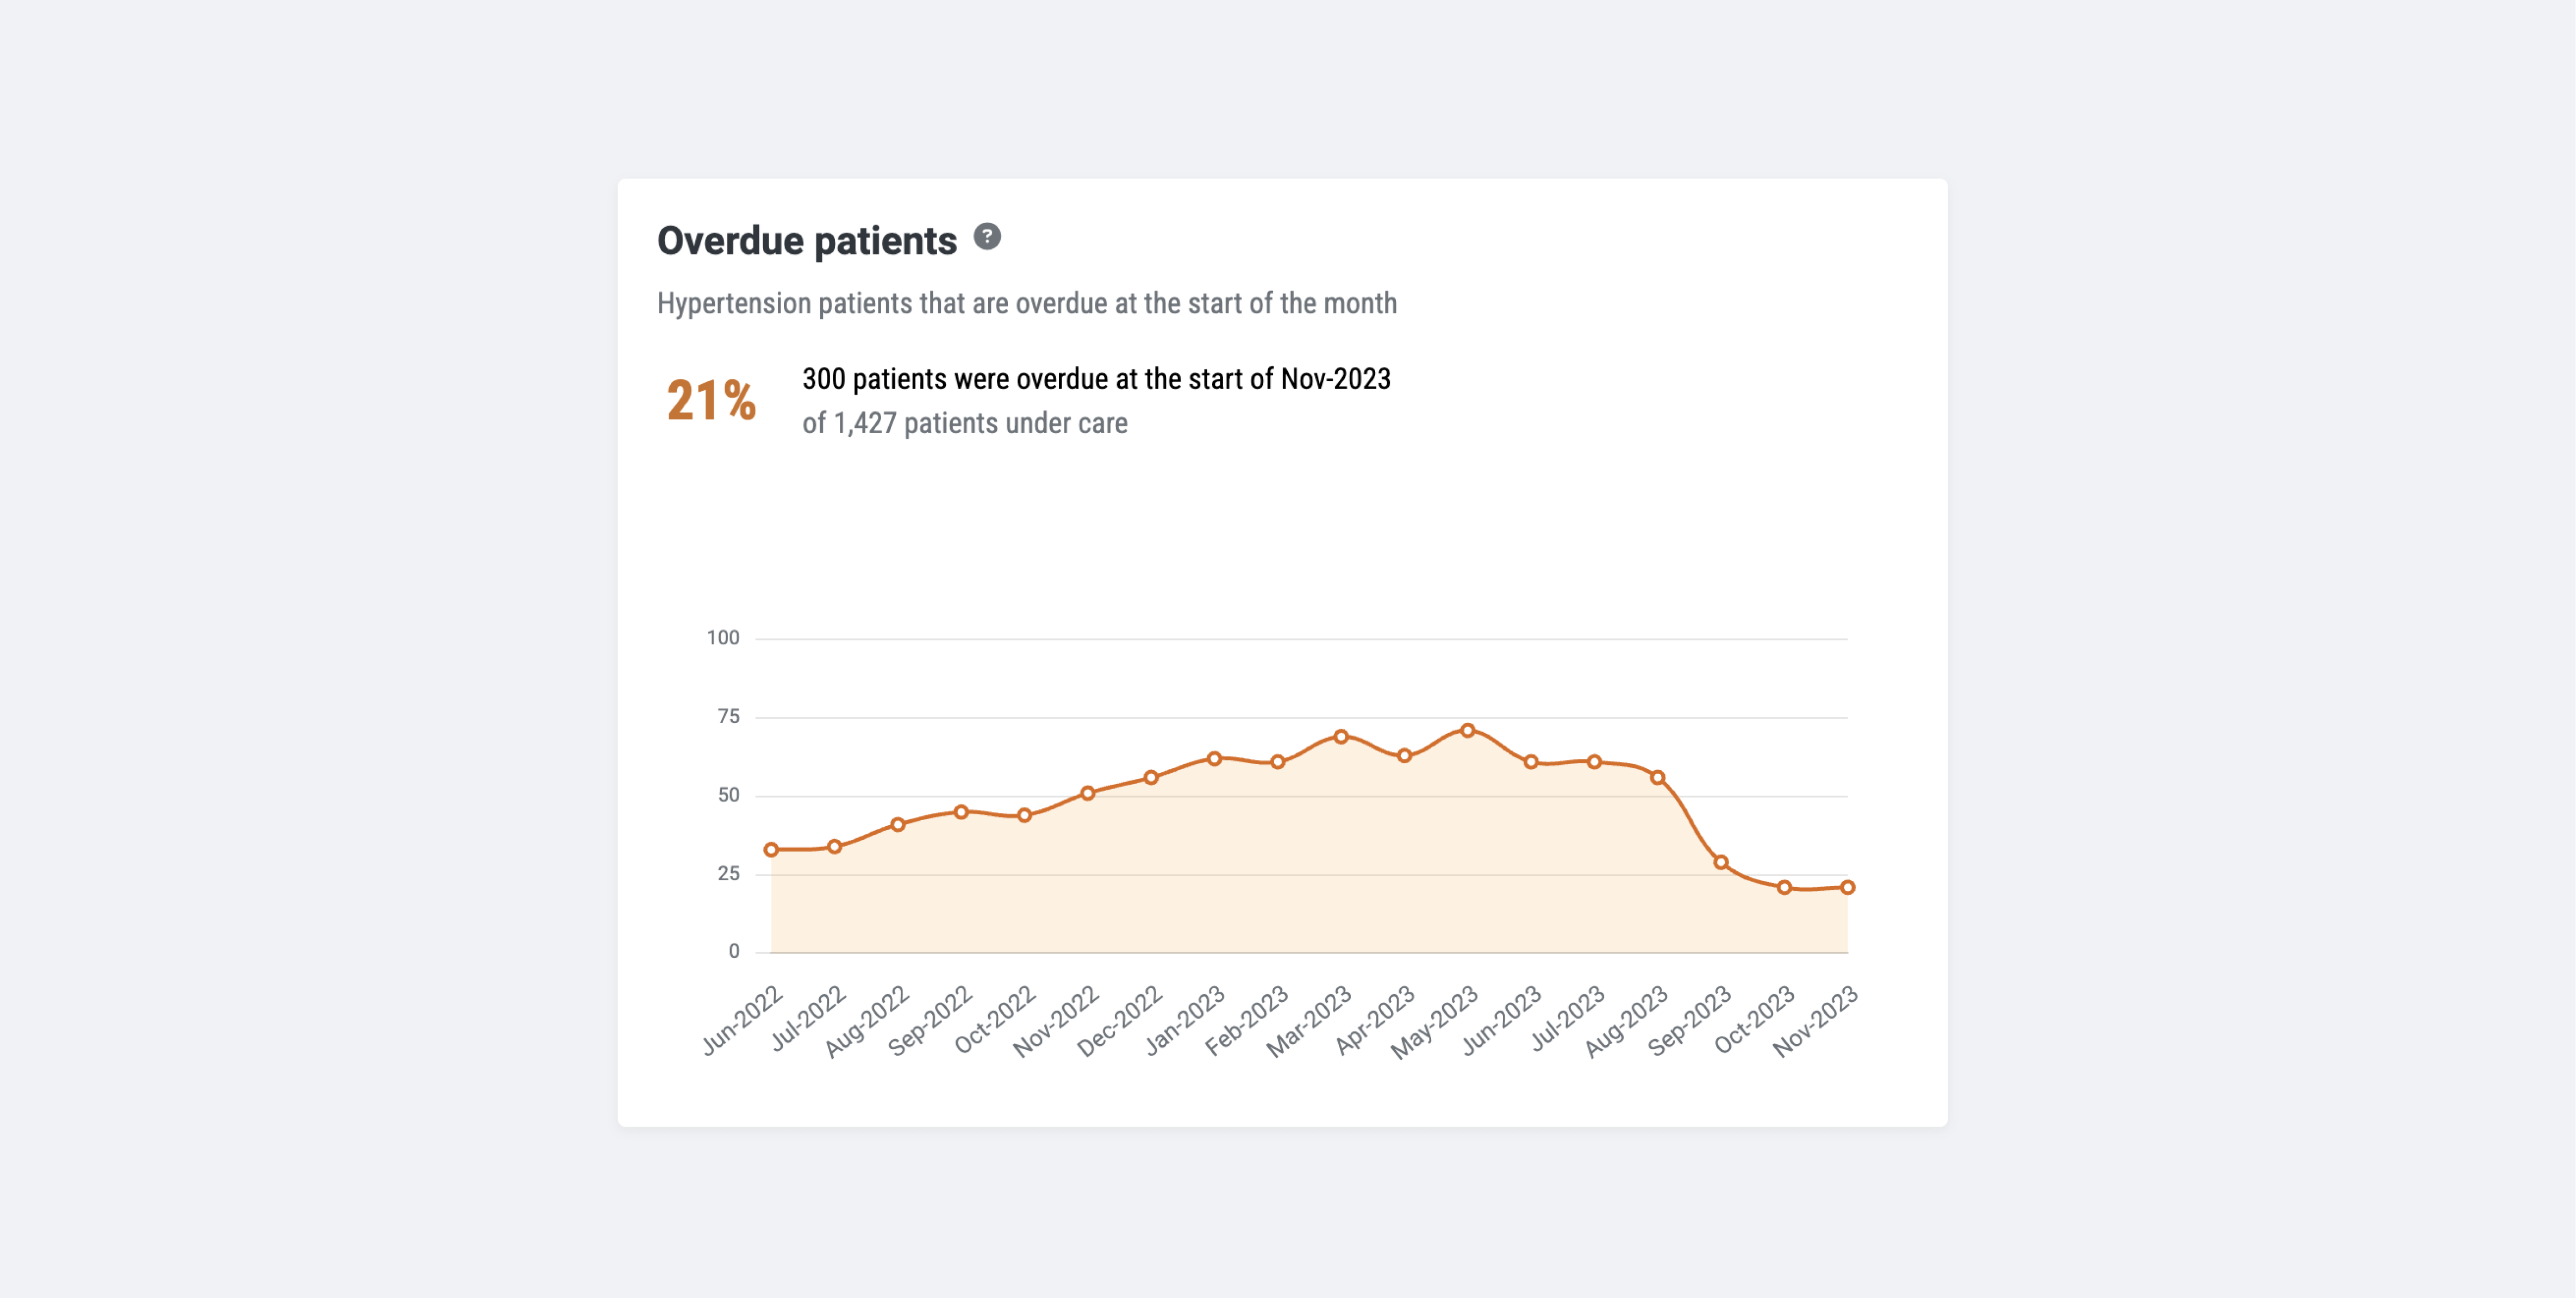
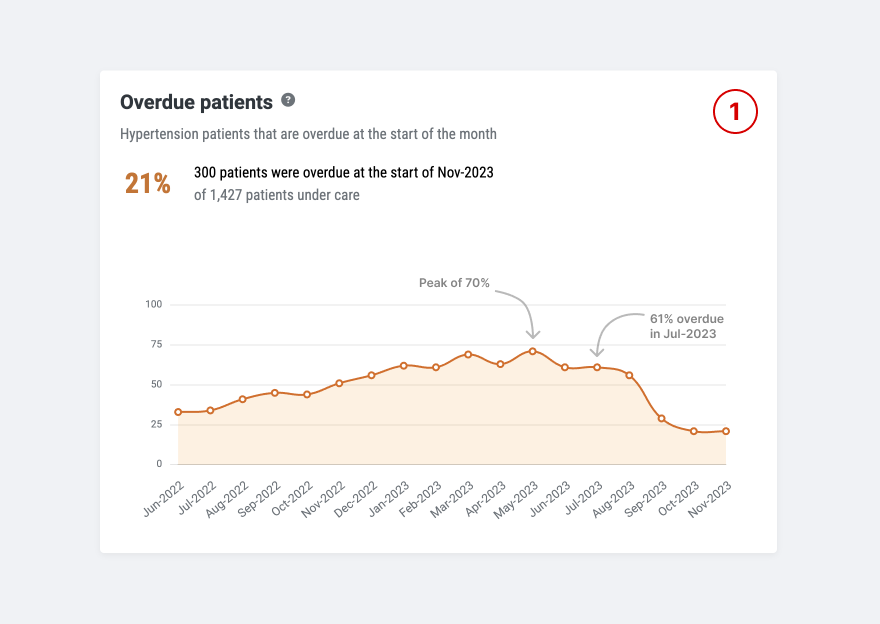
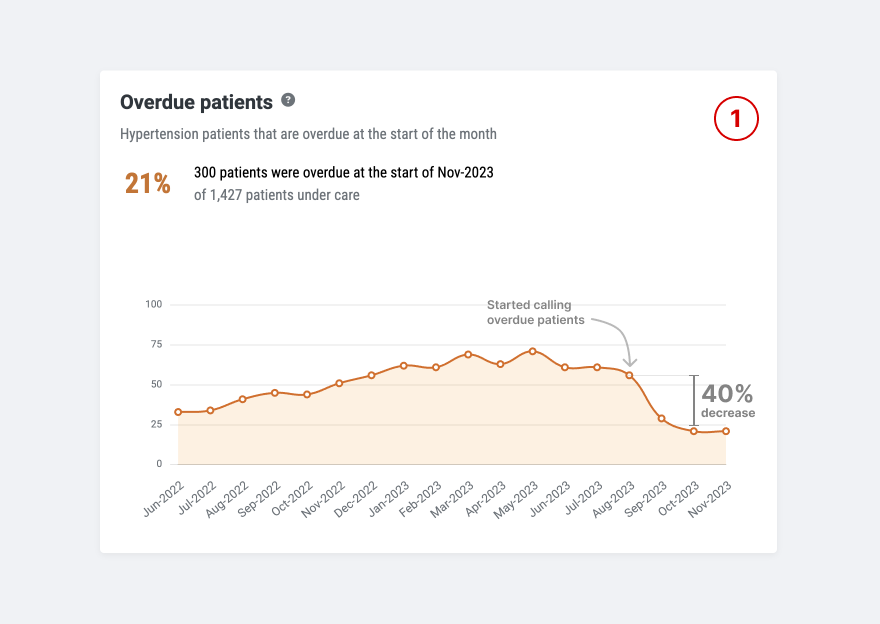
How many patients are overdue?
Almost all patients recorded in Simple have a follow-up appointment. Patients who don’t visit by their appointment date are moved onto a call list of ‘Overdue’ patients.
It’s challenging to calculate the number of overdue patients in a meaningful way because this number shifts over time. We made a decision to ‘snapshot’ the number of overdue patients on the first day of the month, each month. This establishes a defined timeframe to calculate the number of overdue patients and display a trend over time.
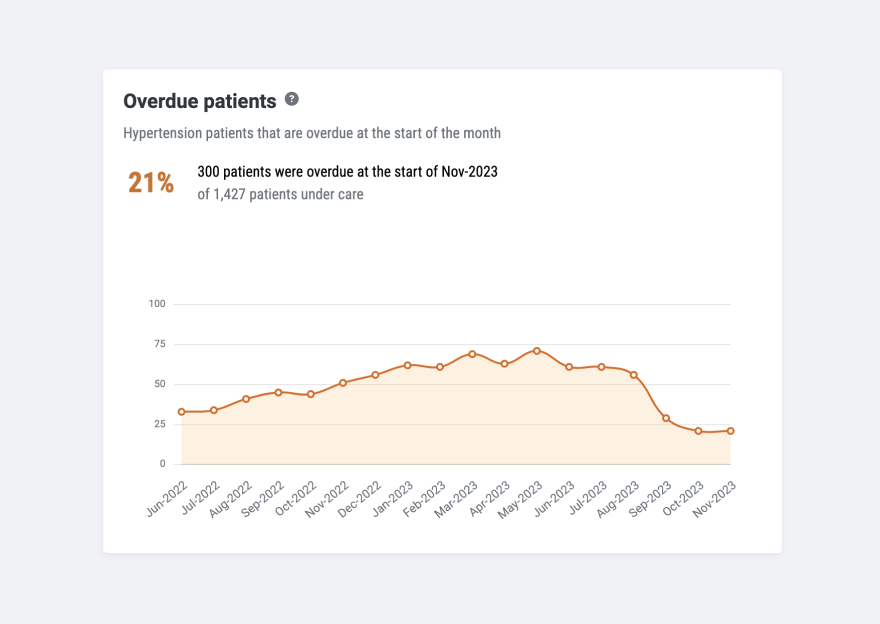
The chart displays the number of overdue patients and provides program managers with a measurable target to reduce the percentage of overdue patients each month. We reveal the size of the problem.
“showing the number of overdue patients provides program managers with a quantifiable target to reduce this each month”
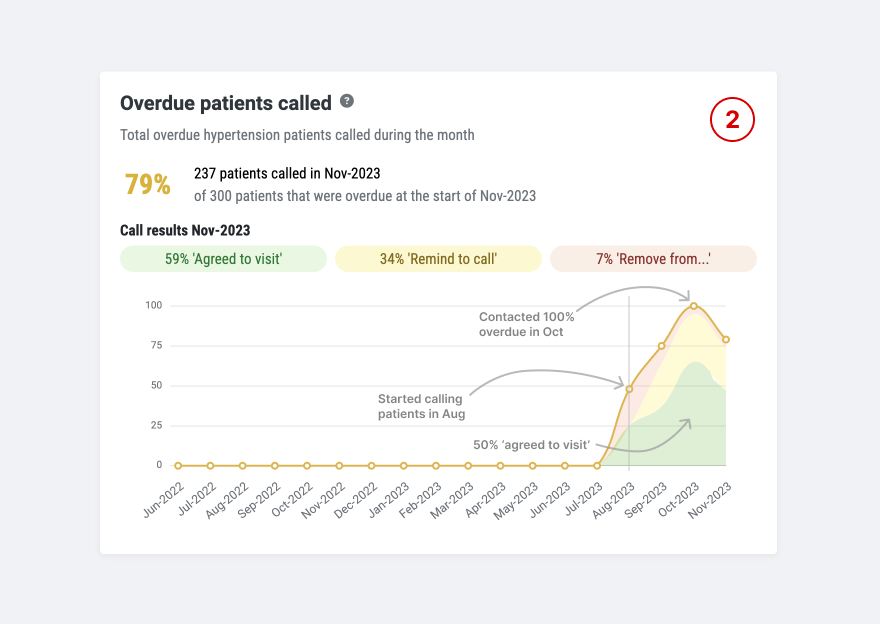
How many overdue patients were called?
Ideally, all overdue patients should be called promptly to motivate them to attend a regular blood pressure check-up. To encourage calling, we provide hospital staff with an easy-to-use overdue patient calling list in the Simple app — in the dashboard, we provide managers with a chart that displays the number of unique overdue patients called during the month.
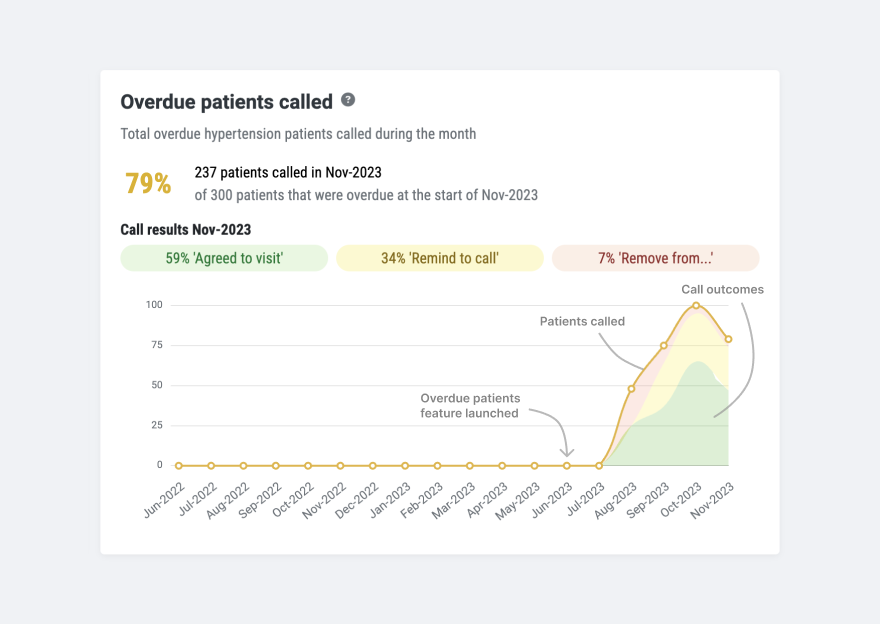
The chart shows how many unique overdue patients were called during the month and provides program managers with a measurable target to increase the number being called each month. We reveal if action is being taken to address the problem.
Additionally, the outcome of the calls is displayed as a secondary trend using red, yellow, and green bands revealing how overdue patients are responding to calls, indicating the effectiveness of this approach.
Highlighting the trends in call outcomes helps monitor the impact of training on call outcomes and, more importantly, provides program managers with a measurable target to improve the call outcomes by increasing the number of patients who agree to visit.
“We clearly see that hospitals are making more calls to overdue patients since these reports were made available”
The call data is used in 2 more performance comparison tables.
- Table 1: Shown to regional managers, displays the performance of districts in a region.
- Table 2: Shown to facility managers displays the call activity of individual staff.
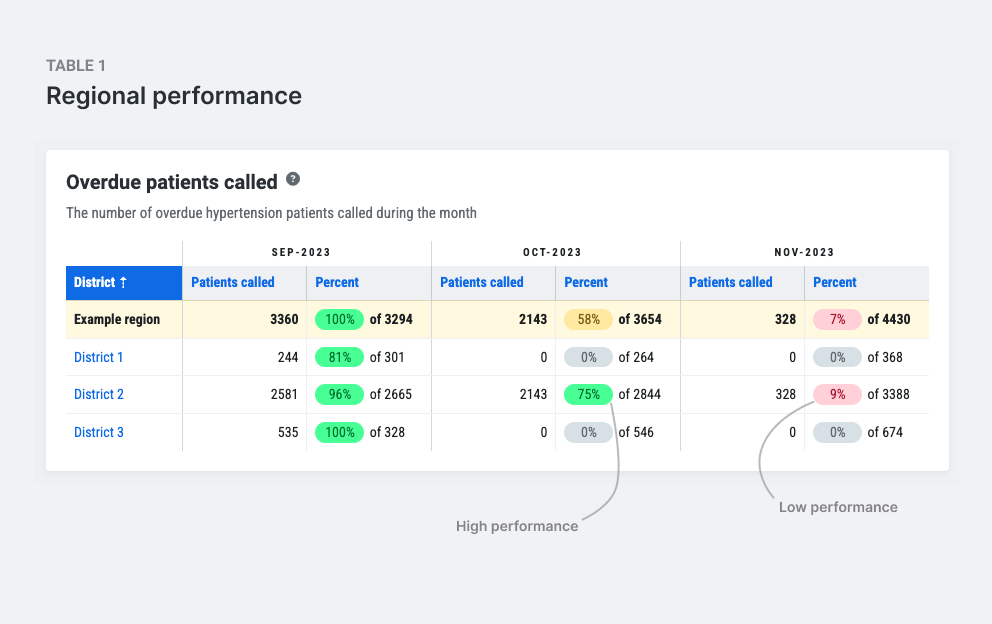
The regional breakdown compares performance between districts, making it easy for regional managers to identify high-performing districts and share knowledge acquired in those districts. It also allows program managers to focus their attention on low-performing districts.
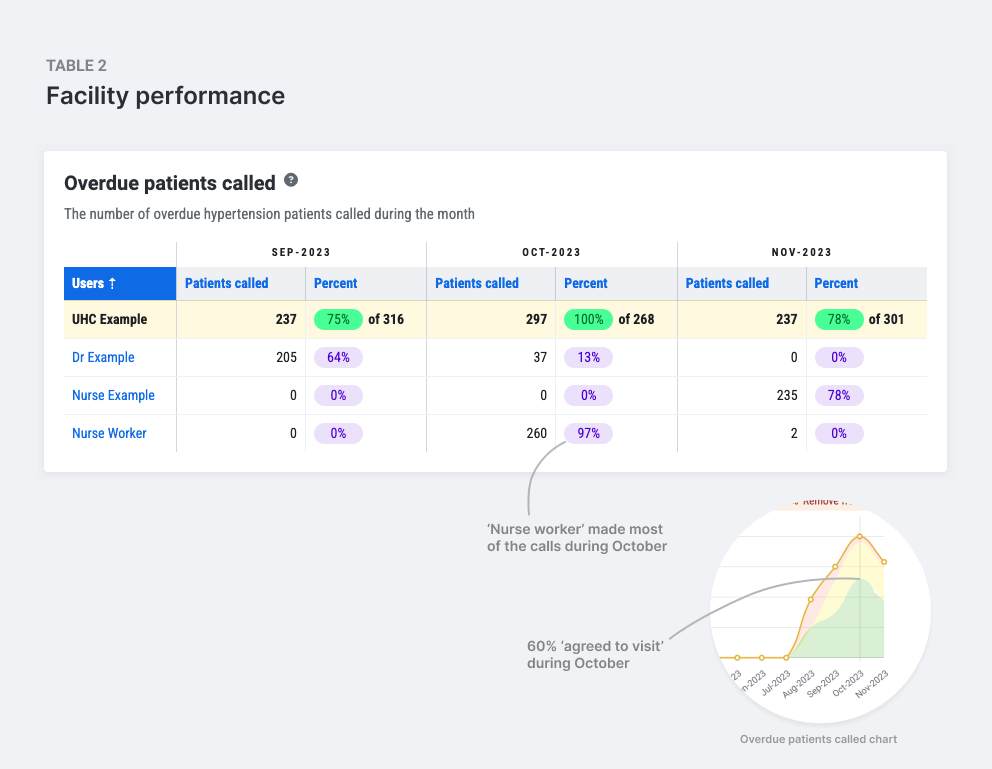
The facility breakdown reveals which team members are making the calls and provides an additional feedback loop linking call outcome trends with specific staff. It encourages knowledge sharing between team members.
“One of the countries even set up a centralized call center to help manage overdue patient calls— achieving over 32,000 calls in just 3 months!”
Are calls motivating patients to attend?
The overarching aim is to encourage patients to attend the hospital for regular visits. Does calling overdue patients result in more patients visiting a hospital?
We made a similar ‘snapshot’ decision to show the number of patients who visited the hospital within 15 days of receiving a call. This helps inform if the calls were successful at getting patients to attend in a reasonable timeframe, and display a trend.
A 15-day window provides a suitable middle-ground between the urgency of attending for a check-up and consideration of the day-to-day challenges patients face that result in delayed attendance.
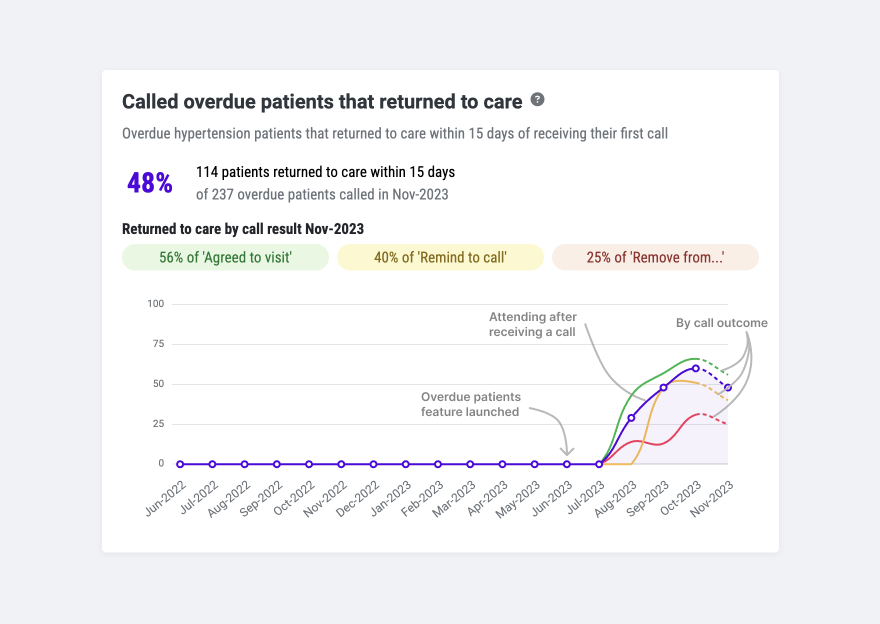
This chart shows how many overdue patients visited the hospital within 15 days of receiving a call and provides program managers with a measurable target to improve the effectiveness of the calls. Here we reveal if the action is successfully addressing the problem.
Additionally, we show the number that visited a clinic within 15 days based on their call outcome seen through the colored lines on the chart. This data provides program managers with a better understanding of patient behaviors, for example, if patients who ‘Agreed to visit’ actually attend the hospital. Again, the aim is to empower program managers to be able to ask more questions about what is happening on the ground.
“Overdue patients who receive a call are more likely to attend a clinic within 15 days regardless of the outcome of the call.”
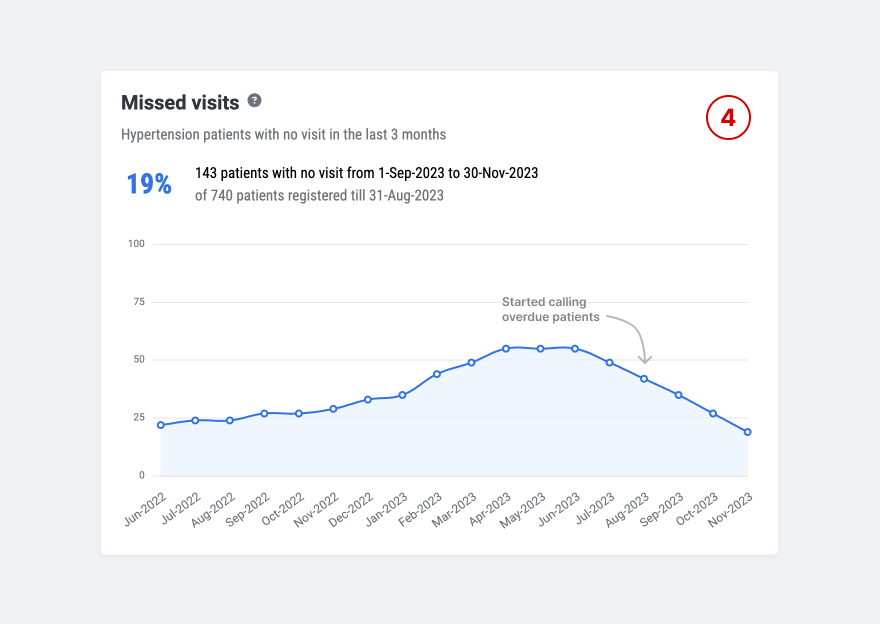
The bigger picture
The overdue charts are designed to act as a feedback loop for one of our main program indicators — ‘missed visits’. Patients marked as ‘missed visit’ have not visited a clinic in the last 3 months.
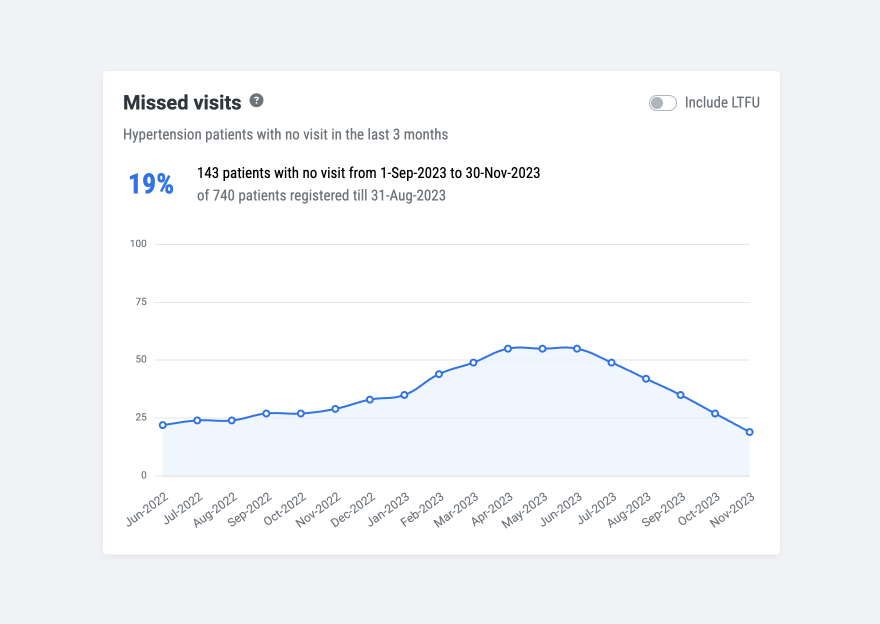
Reducing the number of overdue patients directly impacts the number of patients marked as ‘missed visits’. Having patients attend regularly for check-ups offers a more accurate picture of blood pressure control in hypertension programs.
Does it work?
Exploring the overdue charts for a hospital we can see how this data can be utilized by program managers. Below we can find an example hospital and read the story behind overdue patients.
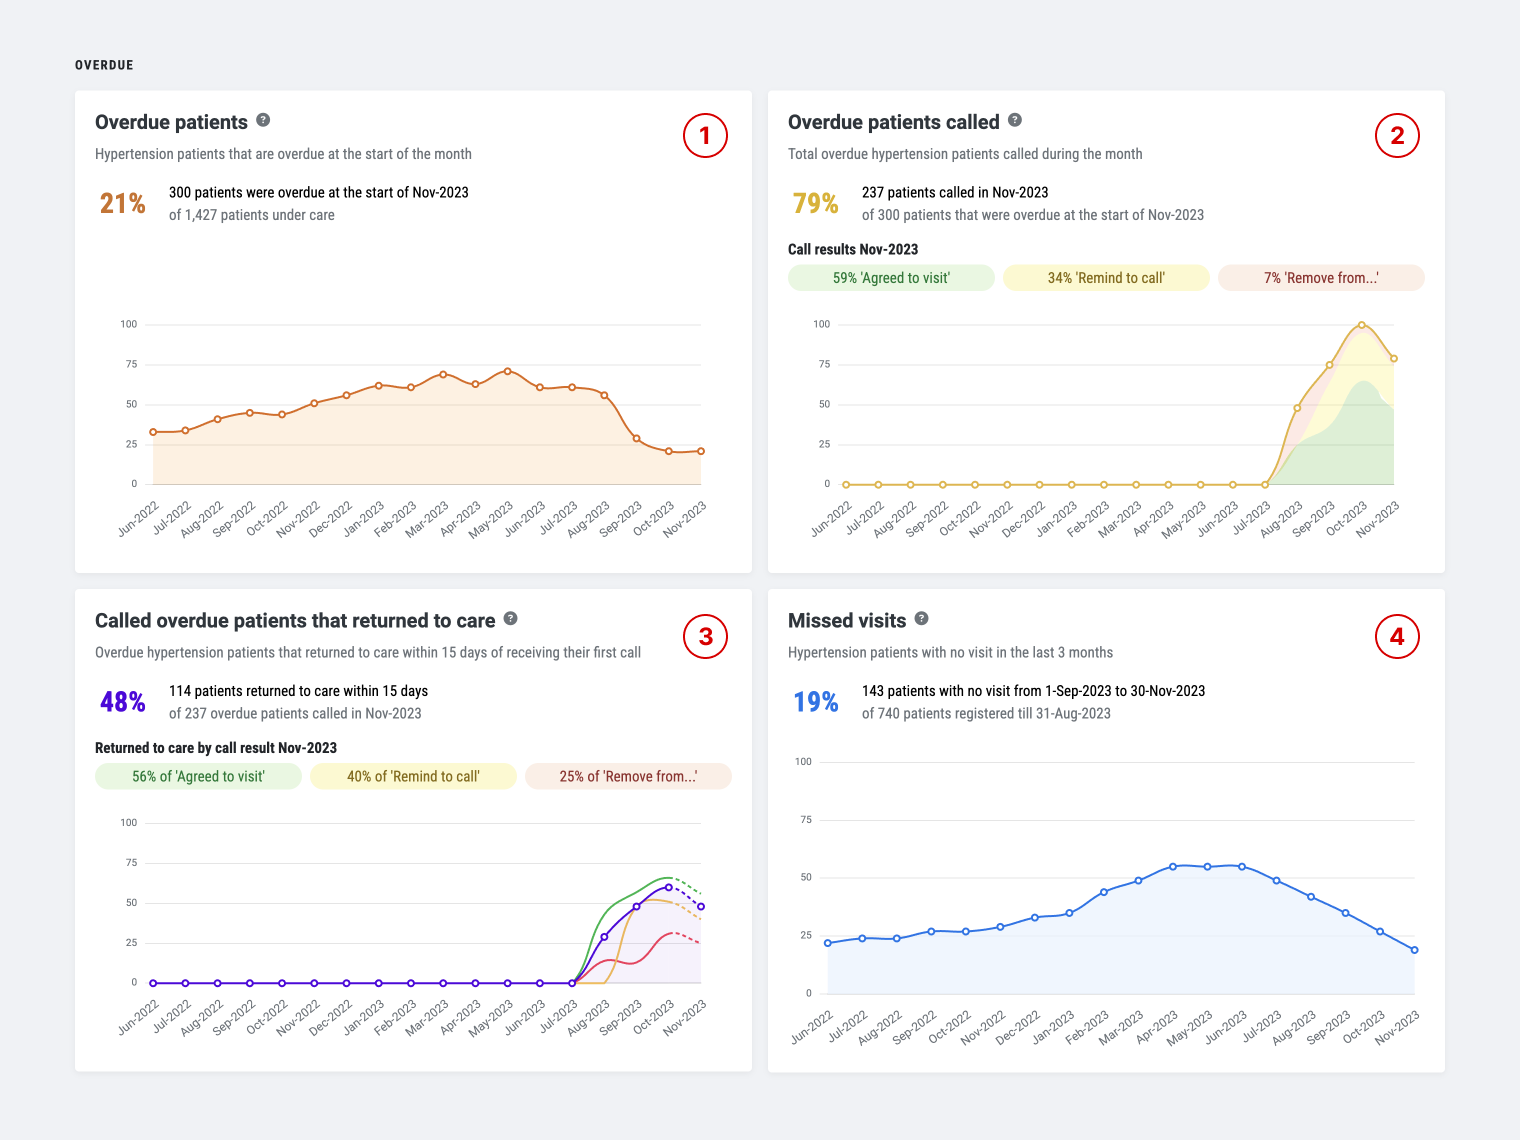
How many overdue patients need to be called?
From chart 1 we see that in Jul-2023, 61% of the patients were overdue with a peak of 70% in May-2023.
How many overdue patients were called?
Moving to chart 2, we discover that in Aug-2023 this hospital began to call overdue patients. 50% of the overdue patients were called in Aug-2023 increasing to 75% in Sep-2023 and 100% in Oct-2023 — this is exceptional! Reading deeper we can see that around half of the calls resulted in ‘Agreed to visit’ (the green band).
Did the patients visit a hospital after the call?
Chart 3 illustrates a month-over-month increase in the number of patients attending the hospital after receiving a call. By October 2023, over 50% of patients attended the hospital within 15 days of receiving a call.
Chart 3 data also indicates that patients marked as ‘Remove from overdue list’ are less likely to visit a hospital after receiving a call, which is expected. However, surprisingly the data reveals a significant portion of these patients, 25% in this case, still attended within 15 days.
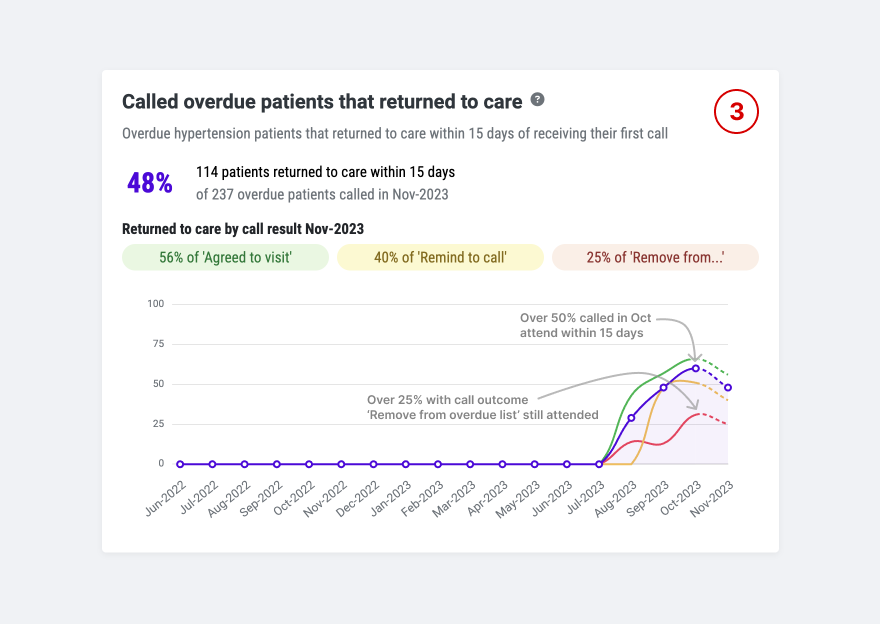
This highlights the power of calls in influencing patient behavior, demonstrating that even when a call does not have a desired outcome, the desired result can still be achieved (the patient attending a hospital).
By revisiting chart 1, it is clear there has been a significant decrease in the number of overdue patients since calling began with a drop from 61% to 21% between August and October 2023.
The big picture
Looking back at the ‘missed visits’ indicator in Chart 4, it's clear that decreasing the number of overdue patients has a direct and positive impact on reducing the number of patients marked as ‘missed visits’. A decrease from over 60% to 20%. This is an outstanding achievement.
Conclusion
Of course, calling overdue patients is not a silver bullet solution to patient retention. Other strategies like implementing patient-centered care, steady supply of medications, and sending SMS patient reminders are also effective parts of the toolkit for a successful non-communicable disease program. But, done right, overdue calling is a very effective tool to improve patient retention.
In summary:
- Revealing the number of overdue patients encourages action We clearly see that hospitals are making more calls to overdue patients since these reports were made available. One of the countries even set up a centralized call center to help manage overdue patient calls — achieving over 32,000 calls in just 3 months.
- Calling overdue patients works Overdue patients who receive a call are more likely to attend a clinic within 15 days regardless of the outcome of the call.
- Trends data is powerful Program managers can make interventions and see measurable results, showing if the interventions reduced the number of overdue patients over time.
- Performance comparison tables allow for improved knowledge-sharing Comparing performance between hospitals and districts helps identify where overdue calling is effective and allows program managers to focus their attention on low-performers. High-performing locations can share their strategies, which improves the entire health system.
If you would like to discuss how we modeled “Calling overdue patients” in our hypertension dashboard please feel free to reach out to me: [email protected]